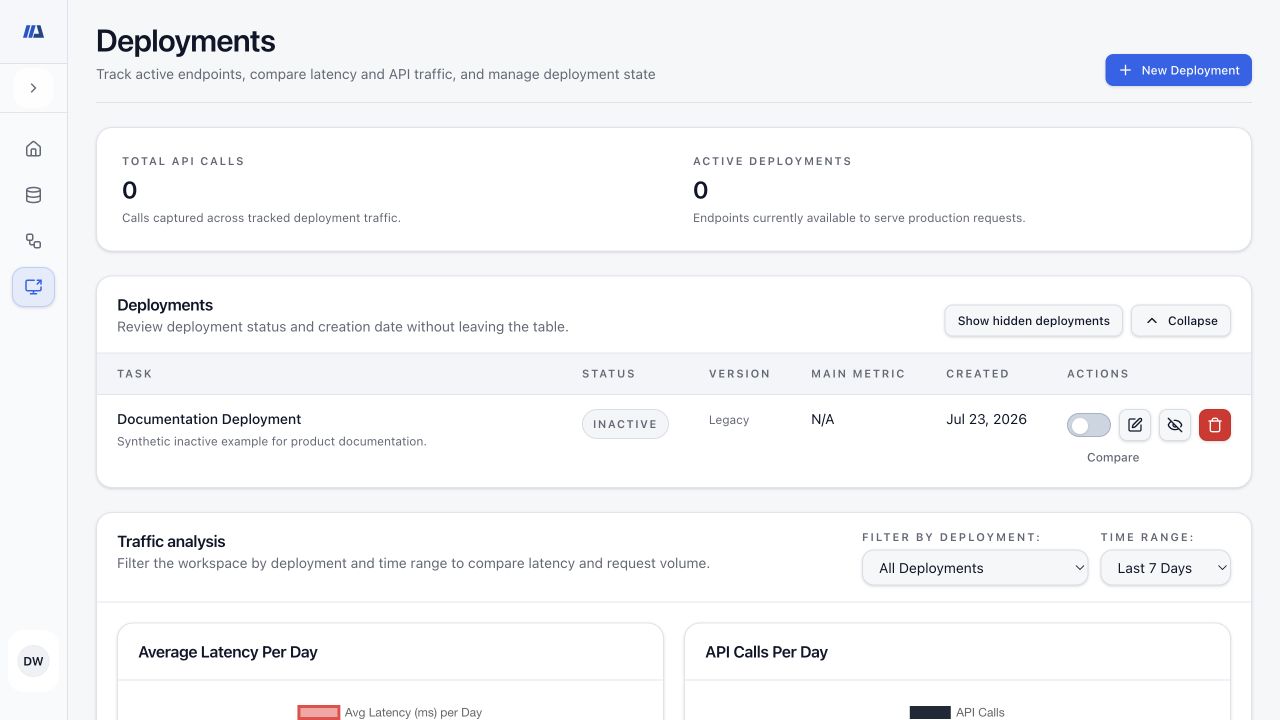
Check the deployment name, description, state, selected version, primary metric, and update date before choosing an action.
Activate or deactivate
Activate only when the model should accept traffic. Before deactivation, identify consumers and communicate the interruption.
Edit descriptive information
Update the name or description without implying that metadata edits change model behavior. If an AI-generated description is offered, review and correct it before saving.
Hide or show the row
Hide reduces list clutter but does not stop traffic. Enable Show hidden to find and restore hidden rows.
Delete only the intended deployment
Confirm the deployment and consumer impact before deletion. Use deactivation first when you need a reversible serving change.
Use Total API Calls and Active Deployments as workspace-level orientation, then filter before drawing conclusions about one deployment.
Choose a deployment
In Traffic analysis, select the intended deployment or the aggregate view needed for the question.
Choose the reporting period
Select an available period such as 7, 14, 30, 60, or 90 days, this month, or this year. Keep the same period when comparing charts.
Read both charts
Average Latency Per Day shows response-time movement; API Calls Per Day shows traffic volume. A change in one can affect how the other should be interpreted.
Download a usage report
Generate the deployment usage report for the selected period, review its context, and store it according to workspace policy.